

Understanding how your data is being accessed is critical to maintaining security and compliance. When a user runs a query, do you know what data they touched? And, whether they should have touched it?
To protect data, you need continuous visibility into activity – the who, what and how of every query. That’s where ALTR’s Activity Monitoring Dashboard comes in.
ALTR’s Activity Monitoring Dashboard provides a real-time view into query behavior across users, roles, IP addresses and tagged data. By surfacing trends and anomalies, it helps teams detect issues early, investigate quickly and strengthen their overall database security posture.
Here are five signs of suspicious or unusual activity to watch for and how monitoring helps you detect them early.
1. Query Spikes from a Single User or Role
One of the most common indicators of risks is an unexpected surge in query activity from a single user. In a database security audit or a security checklist, this behavior is often flagged as a sign of credential misuse, shared accounts or potential data exfiltration.
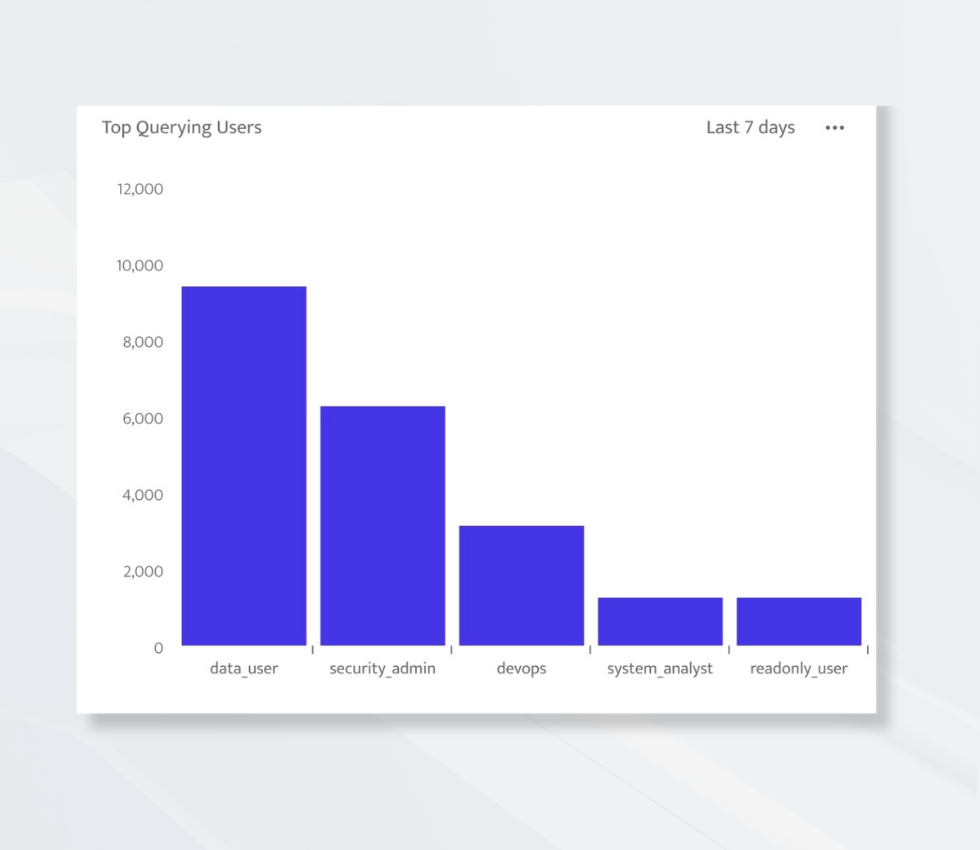
The Top Querying Users metric in the Activity Monitoring Dashboard highlights users generating the most activity. Compare current patterns to historical trends to identify anomalies before they become incidents.
Use Case: If a user suddenly appears at the top of the list after a period of low activity, it could mean their credentials are being used in a new (and possibly unauthorized) way.
2. Large-Scale Data Access
Not all queries pose the same risk. A simple lookup may return a few rows, while a bulk export could retrieve millions of rows. This often indicates that a script or report has been run without proper filters, pulling entire tables instead of targeted datasets.
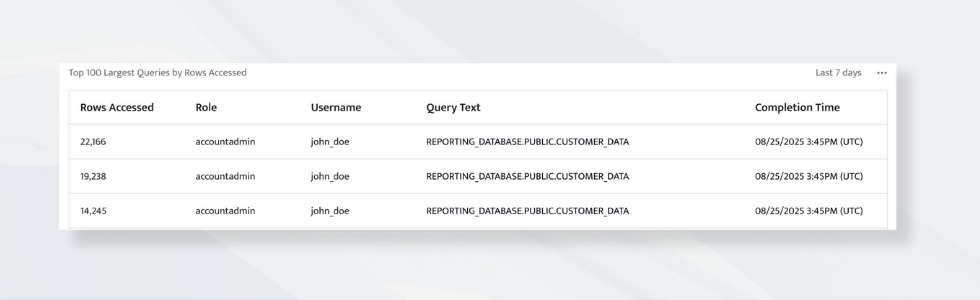
The Top 100 Largest Queries by Rows Accessed chart exposes these outliers to help you spot queries that touch unusually large amounts of data. Large, unfiltered queries against sensitive tables are red flags in any database security audit.
Use Case: An analyst runs an ad-hoc query against a production dataset and unintentionally retrieves all customer records. The dashboard helps you catch that immediately.
3. Unusual Source IP Addresses
Even when user credentials are legitimate, the where can tell you a lot. Activity from new or unexpected IP addresses may signal unauthorized use of credentials, unapproved automation or misconfigured integrations.
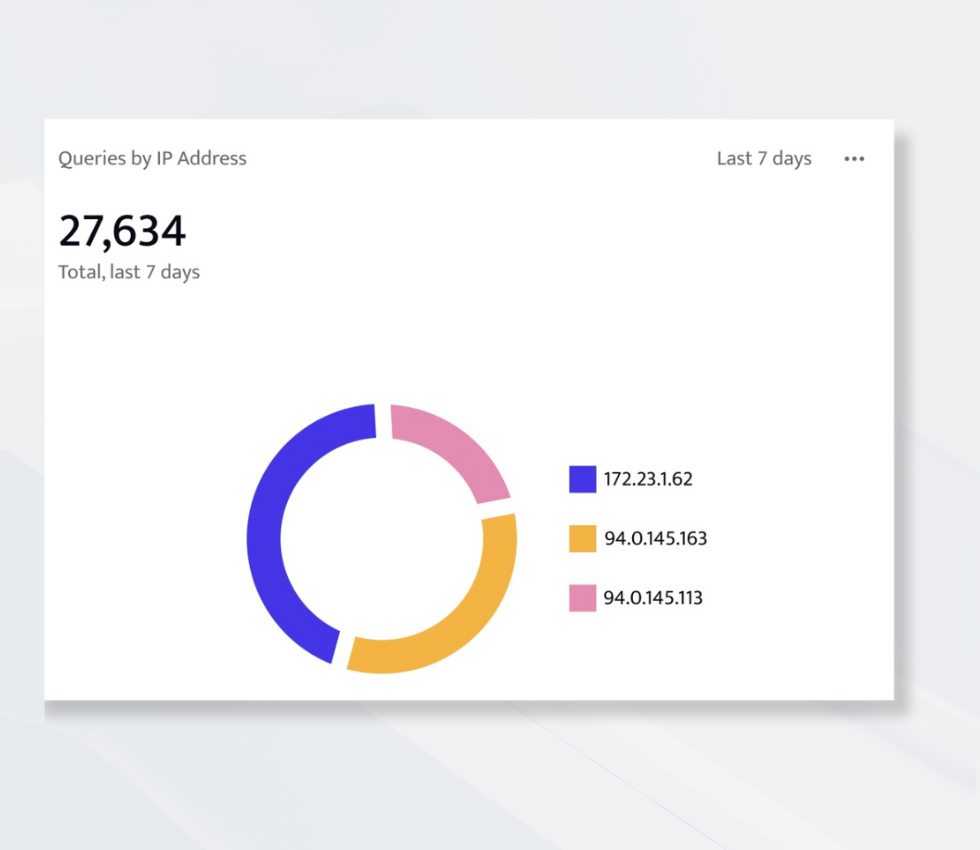
The Queries by IP Addresses visualizations makes this easy by showing all query origins over time. You can quickly see where access patterns shift or when new IP addresses appear.
Use Case: A developer logs in from a region you don’t normally see activity from. The dashboard helps your security team identify and verify that connection in seconds.
4. Access to Tagged Sensitive Data
You can’t protect what you can’t see. Monitoring access to tagged or classified data, such as customer PII or financial information, is a cornerstone of strong database security.
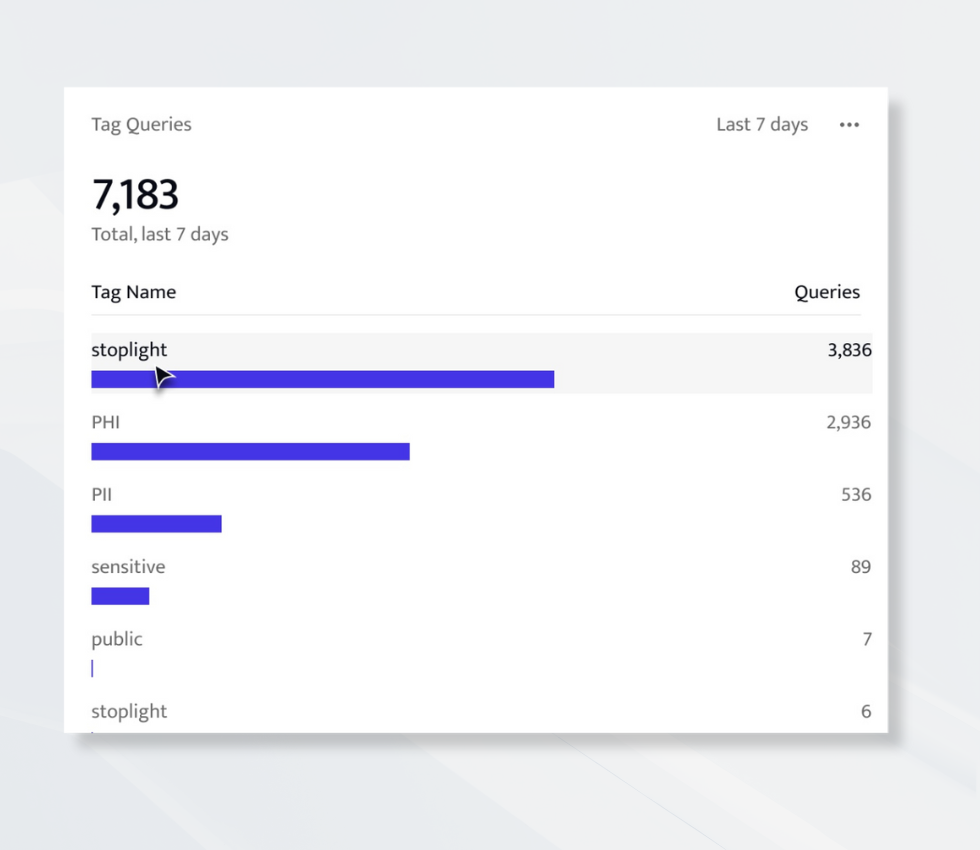
The Tag Queries metric highlights queries against sensitive data, giving you direct visibility into who is touching what. Combined with ALTR’s data classification and access control features, it provides end-to-end insight into sensitive data usage.
Use Case: A support engineer runs a query that includes an SSN-tagged column. The dashboard instantly shows that access, helping confirm whether it was expected or needs review.
5. Activity Outside Normal Hours
Query timing can reveal risk just as clearly as content. Late-night or weekend access might be legitimate automation … or something else entirely.
The Activity Monitoring Dashboard’s time-based views let you spot off-hour query patterns quickly to help you validate whether that activity is planned or potentially suspicious.
Use Case: You notice high query volume at 2 a.m. on a Sunday. With the dashboard, you can easily trace it back to a scheduled ETL job or flag it for further investigation.
In Summary …
At the end of the day, it’s not just who can query your data but who did. ALTR’s Activity Monitoring Dashboard shines a light on the activity that matters, helping you catch unusual behavior, safeguard sensitive data and maintain a strong security posture in Snowflake. With clear insights into users, roles, IP addresses and tagged data, you can detect issues earlier and respond faster.